Code quality metrics that AI coding agents can actually use
Contents
- Method-level metrics
- Cyclomatic complexity
- Cognitive complexity
- Nesting depth
- Parameter count
- The ABC metric
- Halstead measures
- The composite debt score
- Class-level metrics
- WMC: Weighted Methods per Class
- LCOM4: This class should be split
- TCC: Tight Class Cohesion
- CBO: Coupling Between Objects
- Maintainability index
- The coupling-cohesion quadrant
- Package-level metrics: Architecture health
- Afferent and Efferent coupling
- Robert Martin's main sequence
- Dependency cycle detection
- Code smell detection: Composite thresholds
- God Class
- Feature Envy
- Data Class
- Test gaps: Where quality meets risk
- How agents consume this
Most engineering organizations have a code quality tool. It scans the codebase, posts findings to a dashboard, and a human triages. This workflow made sense when humans were the only ones writing code.
Agents work differently. They read files, write changes, and move on. When an agent opens a repository, it has no visibility into which classes are overburdened, which packages are in dependency cycles, or which untested methods carry the most risk. That information exists in most organizations. The problem is it lives on a server, not in the repository. Moderne Prethink puts it in the repository, as structured CSV and Markdown files the agent reads before writing a single line.
This post covers every metric Prethink computes: what it measures, why it matters specifically for agents, and how the metrics combine to produce actionable signals.
On-demand demo
See these metrics in action on a real codebase.
Watch Prethink surface complexity, LCOM4, and test gaps before an agent writes a single line.
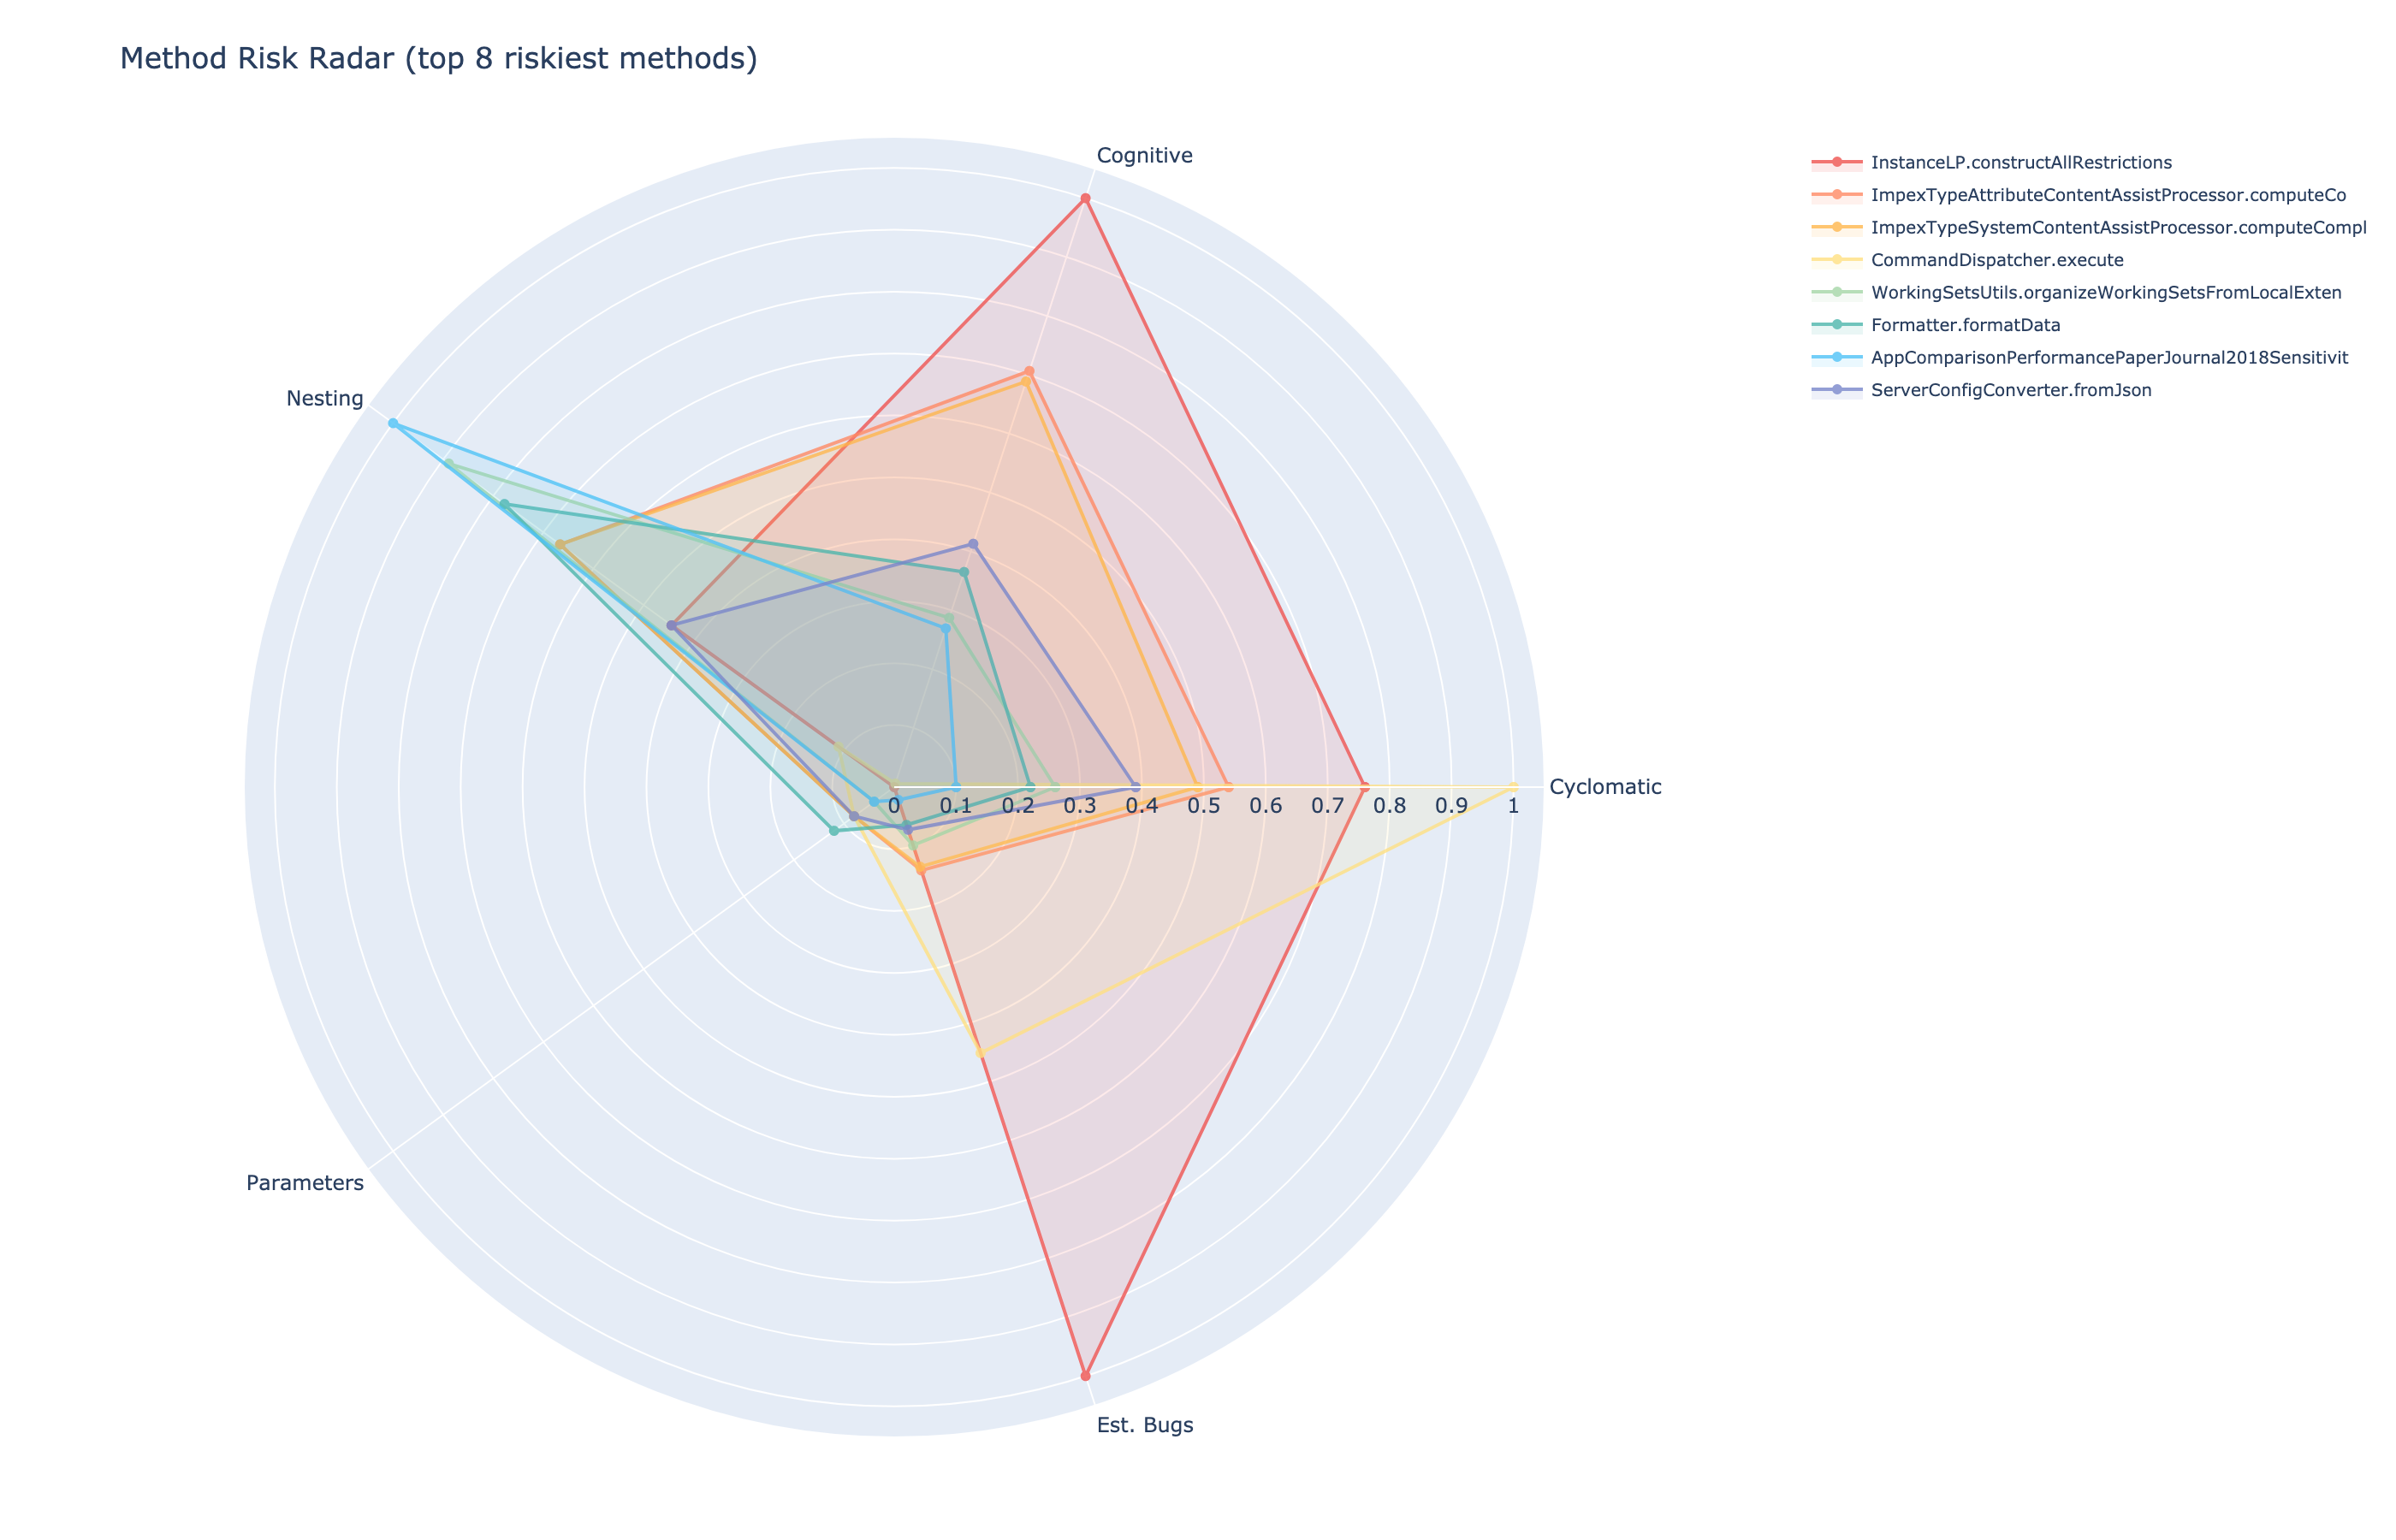
Method-level metrics
Methods are where agents spend most of their time. Method-level metrics tell an agent how risky a modification is and what kind of change to make.
Cyclomatic complexity
Thomas McCabe introduced cyclomatic complexity in 1976. The idea is simple: count the linearly independent paths through a method. Every if, for, while, switch case, catch, and boolean operator adds a path. A method with no branches has complexity 1. Real-world methods with nested conditionals, loops, and exception handling can reach 20 or higher with ease.
Every static analysis tool reports cyclomatic complexity, and that ubiquity is both its strength and its limitation. Two methods with the same score can feel completely different to maintain: one a readable flat switch statement, the other three levels of nested conditionals. Cyclomatic complexity can’t tell them apart. For an agent deciding whether to modify a method or extract a new one, that difference matters.
Cognitive complexity
Cognitive complexity, introduced by Ann Campbell at SonarSource in 2017, improves on cyclomatic complexity by penalizing nesting. The deeper the nesting, the more each additional branch costs. It also handles else if chains more intuitively: a sequence of else if adds 1 per branch rather than 1 plus nesting depth, which matches how humans read that pattern.
Prethink computes both. Cyclomatic complexity gives the structural view. Cognitive complexity gives the readability view.
Nesting depth
Maximum nesting depth is its own signal, separate from both complexity measures. A method might have moderate complexity but sit six levels of indentation deep before the core logic. That method is objectively hard to read regardless of its complexity score. When an agent encounters nesting depth above 3 or 4, extracting the inner logic into a separate method is usually the right call.
Parameter count
Parameter count is the simplest method-level signal: how many arguments does this method take? More than 5 parameters is a strong indicator that the method is doing too much, or that a parameter object is warranted. For an agent, a high parameter count is a flag against adding yet another argument to the signature, and a prompt to consider whether the interface itself needs refactoring before new functionality is added.
The ABC metric
The ABC metric, introduced by Jerry Fitzpatrick in 1997, decomposes method complexity into three independent dimensions:
**A (Assignments): **Data mutation. Every =, +=, variable initialization.
**B (Branches): **Function calls. Every method invocation, constructor call.
**C (Conditions): **Boolean tests. Every ==, !=, <, >, !.
The composite score is sqrt(A^2 + B^2 + C^2), but the individual components are where the insight lives. High A and low B and C means a data transformer: it’s moving data around. High B means an orchestrator. High C means a decision-maker. An agent that needs to modify an orchestrator should approach it differently than modifying a data transformer.
Formula detail
The composite score is less informative than the individual A, B, and C values. Prethink reports all four.
Halstead measures
Maurice Halstead’s measures (Elements of Software Science, 1977) count operators and operands, the lexical tokens, rather than control flow structures. From four basic counts, Halstead derives volume (how much information the method contains), difficulty (how error-prone it is), and estimated bugs.
The estimated bugs figure is the most useful for agents. A method with 1.14 estimated bugs is informationally dense enough that errors are statistically likely, a signal for the agent to add test coverage before making changes, not after. Most static analysis tools skip Halstead entirely, which is a shame because the estimated bugs metric alone is worth the computation.
Formula detail
The composite debt score
Each method-level metric tells part of the story. Prethink combines them into a single debt score that surfaces the highest-return refactoring targets:
Formula detail
Weights reflect validated predictors of defect-proneness. Each input is normalized to [0,1] before combining.
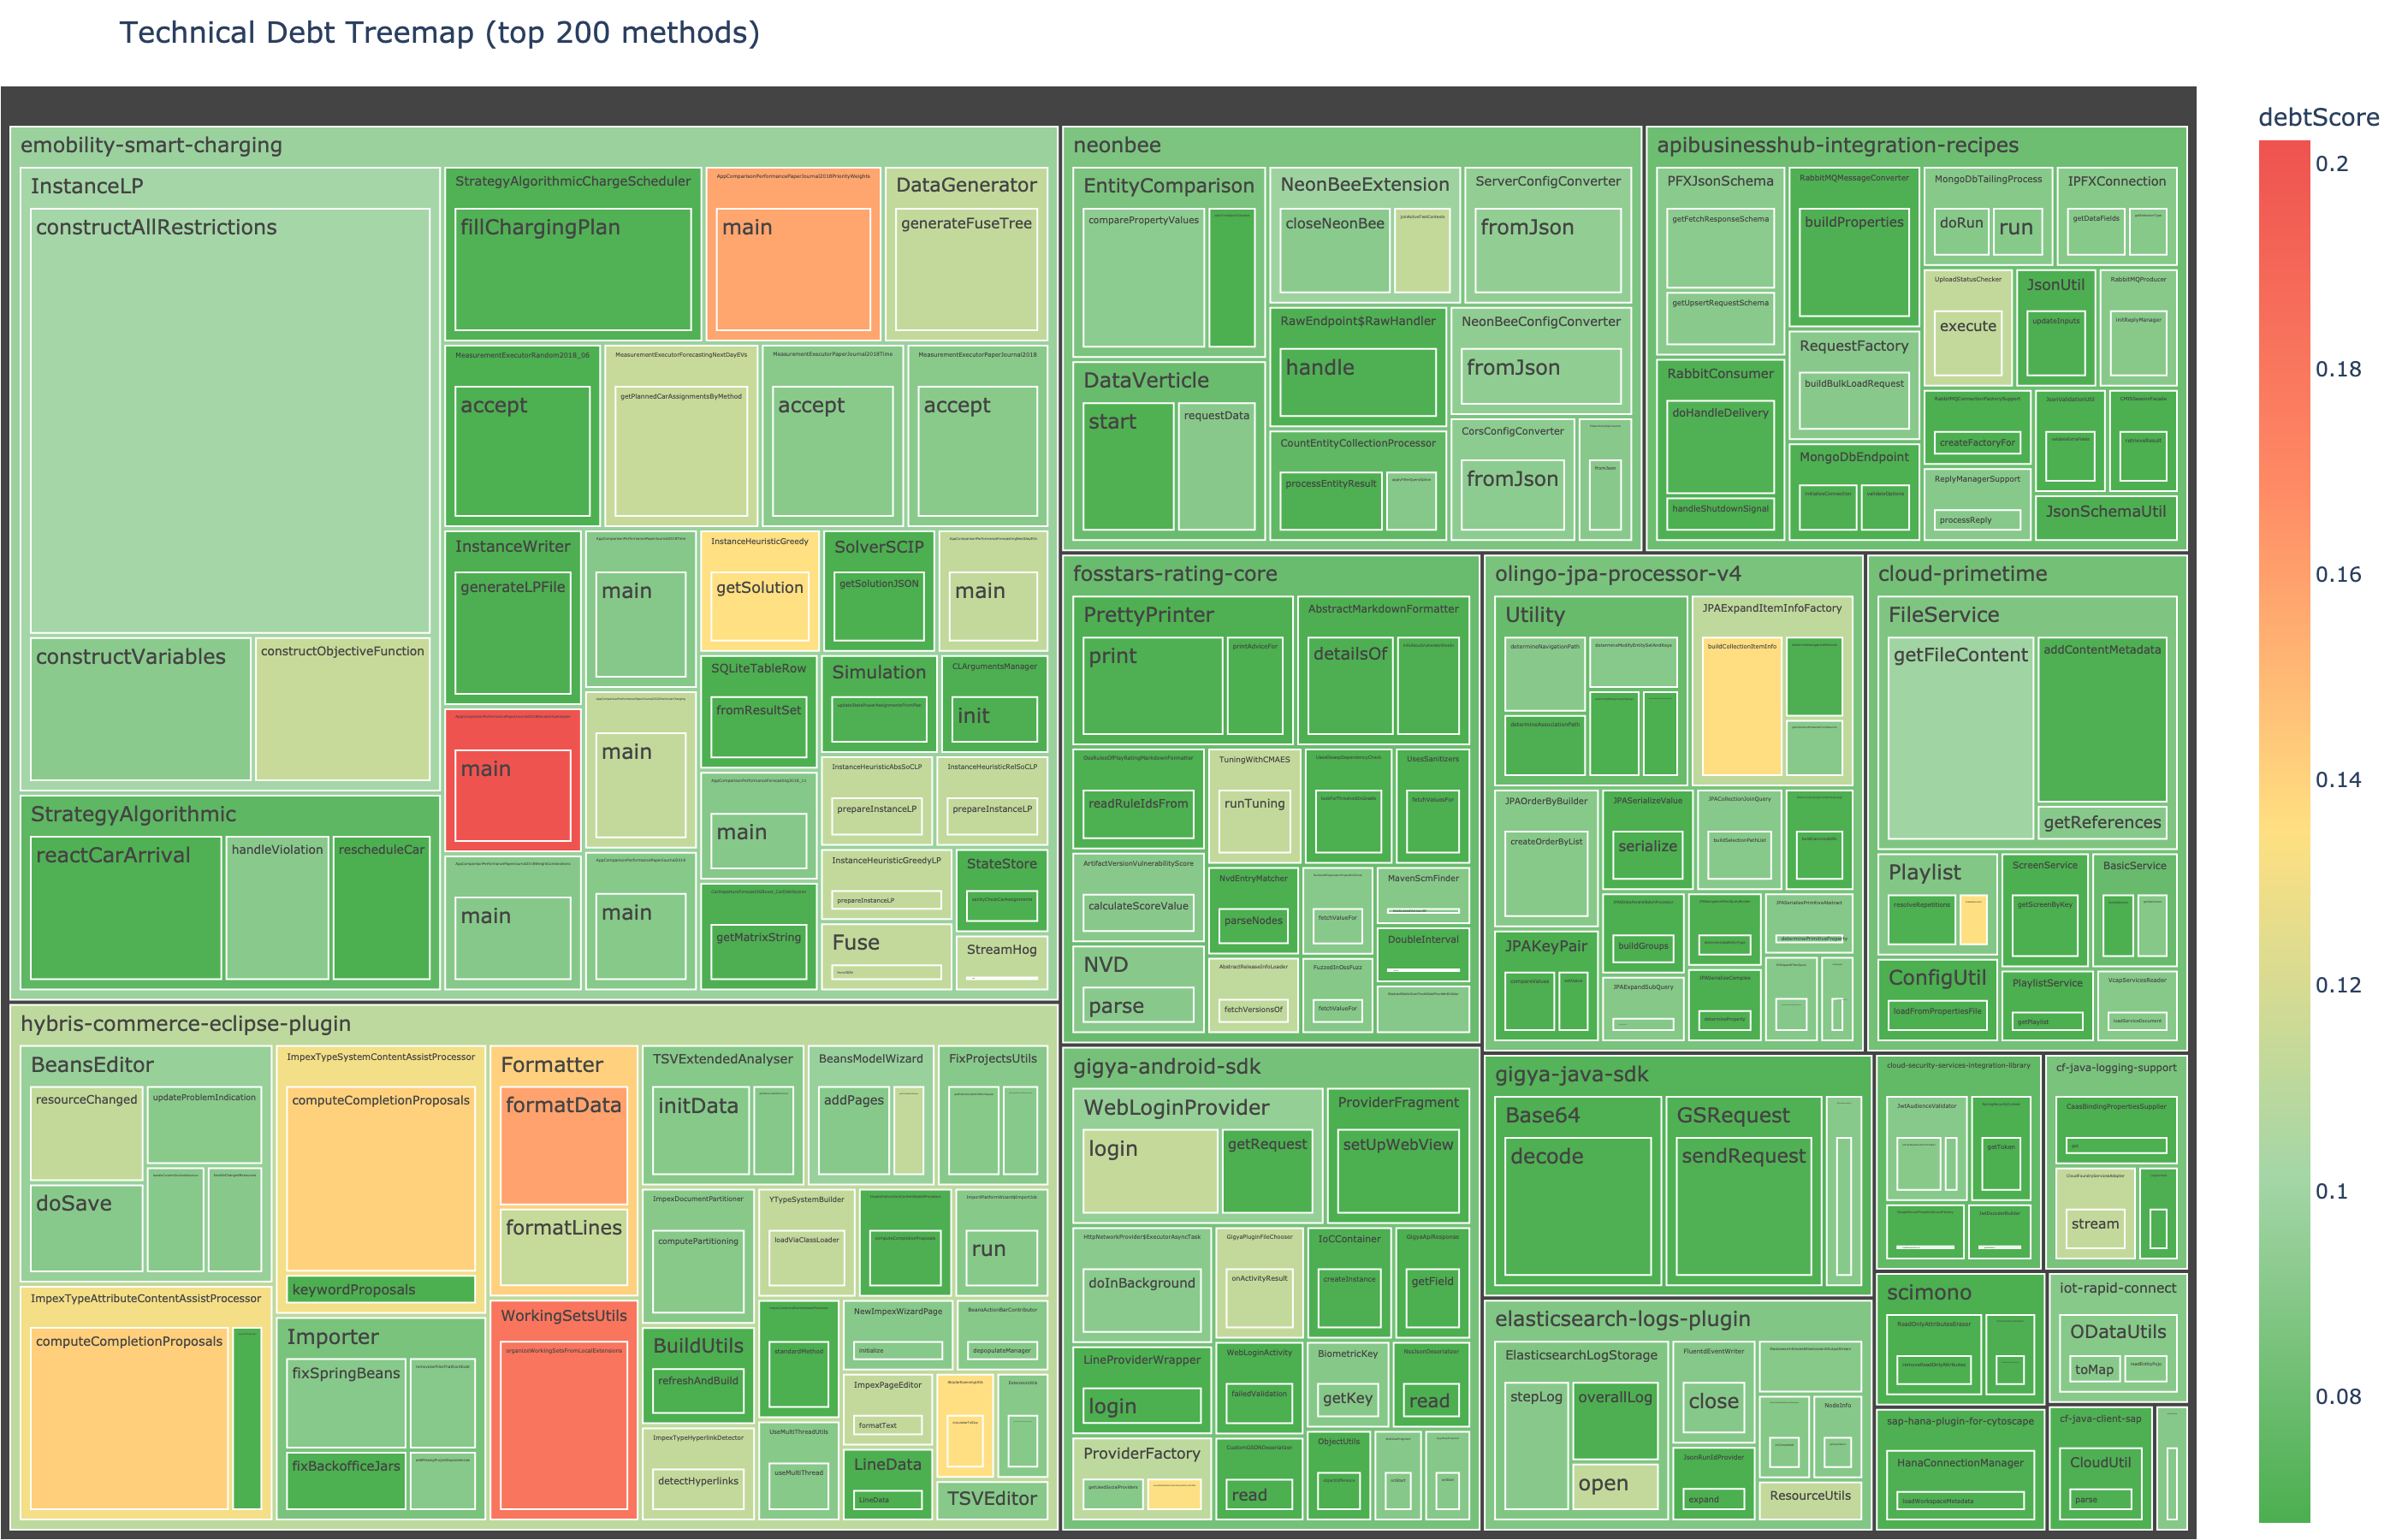
The debt treemap sizes each method by code volume and colors it by this score. The biggest, reddest blocks are the highest-return refactoring targets. An executive doesn’t need to know what cyclomatic complexity means. They point at the red block and say fix that one first.
Class-level metrics
Method-level metrics tell you about individual methods. Class-level design problems, God Classes, anemic models, tangled dependencies, are often the root cause of the method-level symptoms.
WMC: Weighted Methods per Class
WMC is the sum of cyclomatic complexities of all methods in a class. It’s a rough measure of how much is going on. In our analysis of a large enterprise open source portfolio, we found a class with WMC of 339. That class is doing far too much for any agent to safely modify.
When an agent sees high WMC, the right response is not to add more methods to the class. It’s a signal to look at LCOM4 first and understand whether the class should be split before any new functionality is introduced.
LCOM4: This class should be split
LCOM4 (Lack of Cohesion of Methods, Hitz-Montazeri variant) is the metric I’m most excited about, because it produces directly actionable output.
Prethink builds a graph for each class: nodes are methods, edges connect methods that share field access or call each other. The number of connected components in that graph is the LCOM4 score.
LCOM4 = 1 means the class is cohesive. LCOM4 = 3 means the class has three independent groups of methods that don’t interact. In plain language: this class should be split into 3 classes.
When Prethink tells an agent “this class has LCOM4 = 3”, the agent knows not to add more methods to it. If it needs to add functionality, it considers which of the three groups the new method belongs to, and whether the split should happen first.
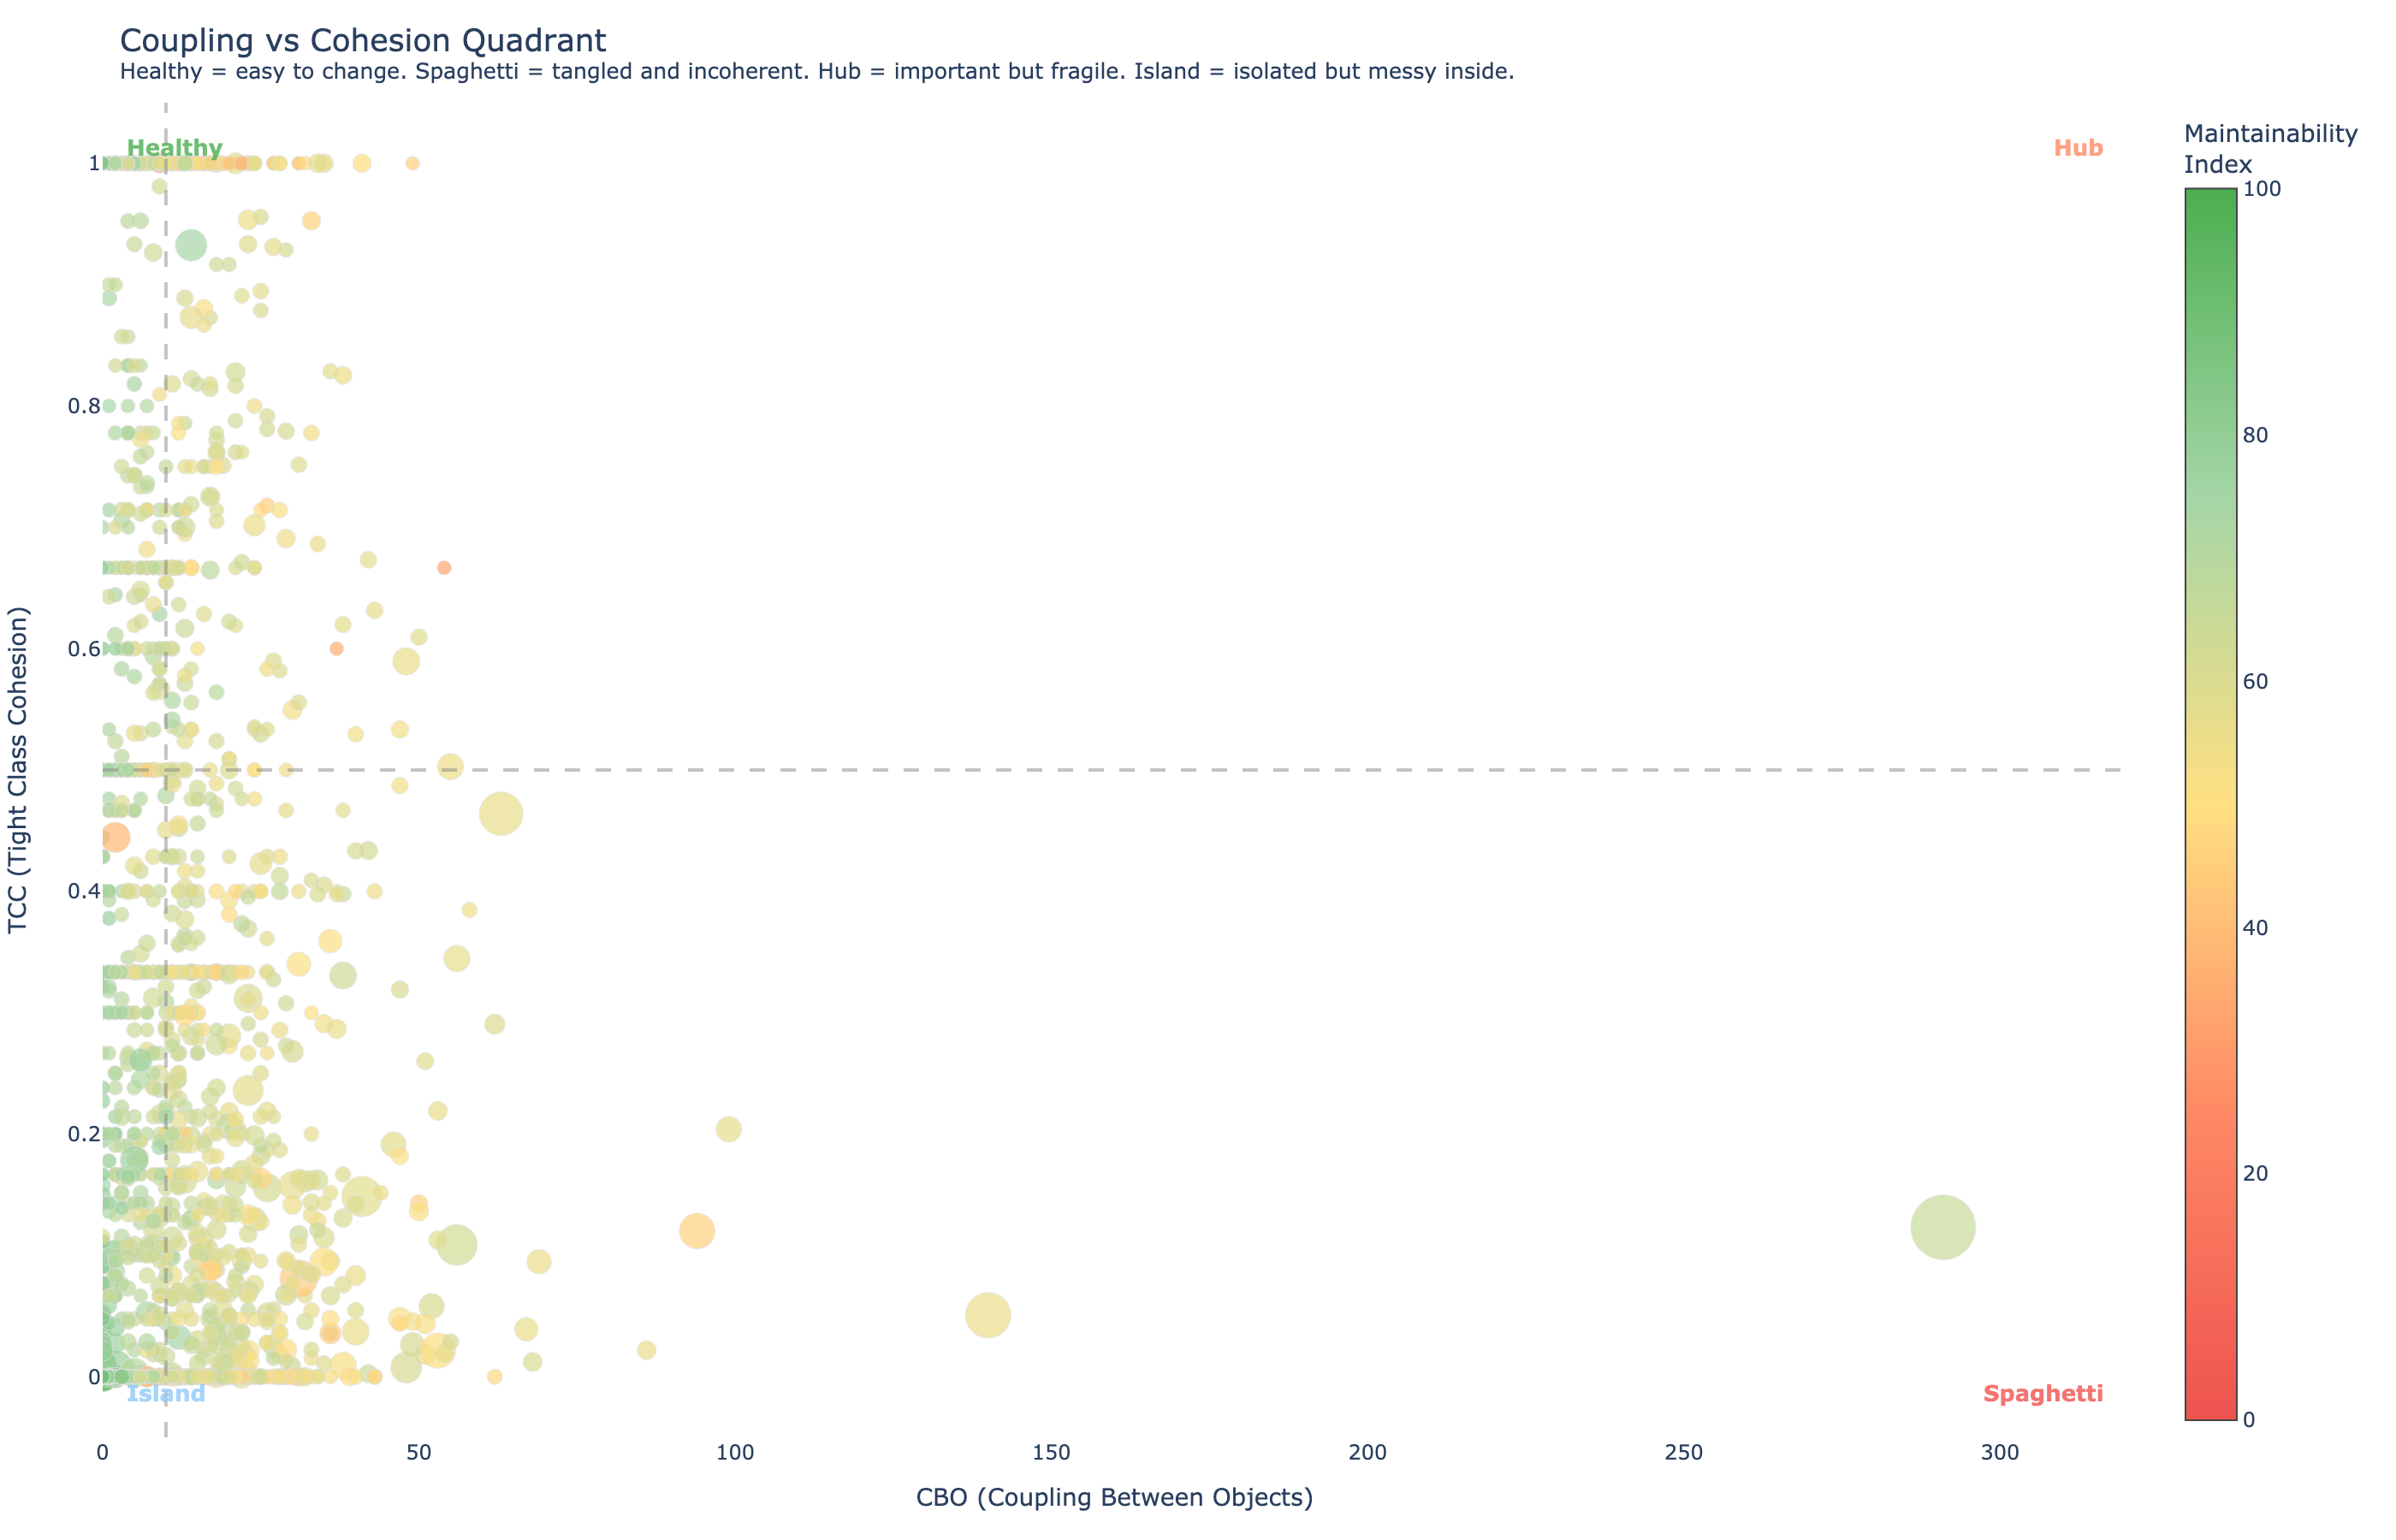
TCC: Tight Class Cohesion
TCC is a normalized cohesion measure: the proportion of method pairs directly connected through shared field access. It ranges from 0.0 (no pairs share fields) to 1.0 (every pair shares at least one field).
Where LCOM4 gives an integer answer (split into N), TCC gives a continuous score. A class with TCC of 0.8 is well-cohesive. A class with TCC of 0.05 is almost certainly doing too many unrelated things. An agent encountering low TCC should treat it as a flag against adding new methods, and a prompt to check whether Feature Envy or a God Class smell has already been flagged on the same class.
CBO: Coupling Between Objects
CBO counts the number of distinct external classes a class references, through field types, method parameters, return types, method invocations, and constructor calls. High CBO means the class is tangled with many others. Changing it risks breaking things elsewhere, and for an agent that means treating any modification as higher-risk than the method-level metrics alone would suggest.
Maintainability index
The maintainability index is a composite score (0-100) combining Halstead volume, cyclomatic complexity, and lines of code. Developed by Oman and Hagemeister in 1992 and adopted by Microsoft’s Visual Studio, it serves as the health score in Prethink’s portfolio view. The top refactoring targets table derives specific actions from the underlying metrics: “Split into 3 classes” or “Reduce complexity”, not just a score.
Formula detail
HV = Halstead Volume, CC = Cyclomatic Complexity, LOC = Lines of Code. Score of 0-100; higher is more maintainable.
The coupling-cohesion quadrant
Plotting CBO against TCC creates four natural categories that tell an agent how to approach a class:
**Healthy **(low coupling, high cohesion): Easy to change, well-designed.
**Spaghetti **(high coupling, low cohesion): Tangled and internally incoherent. The worst case. Refactor before modifying.
**Hub **(high coupling, high cohesion): Internally coherent but fragile, because many other classes depend on it. Modify with caution.
**Island **(low coupling, low cohesion): Isolated but messy inside. Low risk, but could be cleaner.
Package-level metrics: Architecture health
Individual classes exist within packages, and the relationships between packages define the architecture. Prethink surfaces architectural decay before agents introduce more of it.
Afferent and Efferent coupling
**Afferent coupling (Ca) **counts how many other packages depend on this one. **Efferent coupling (Ce) **counts how many packages this one depends on.
Formula detail
I = 0.0: maximally stable (many depend on it, depends on nothing). I = 1.0: maximally unstable (depends on everything, nothing depends on it).
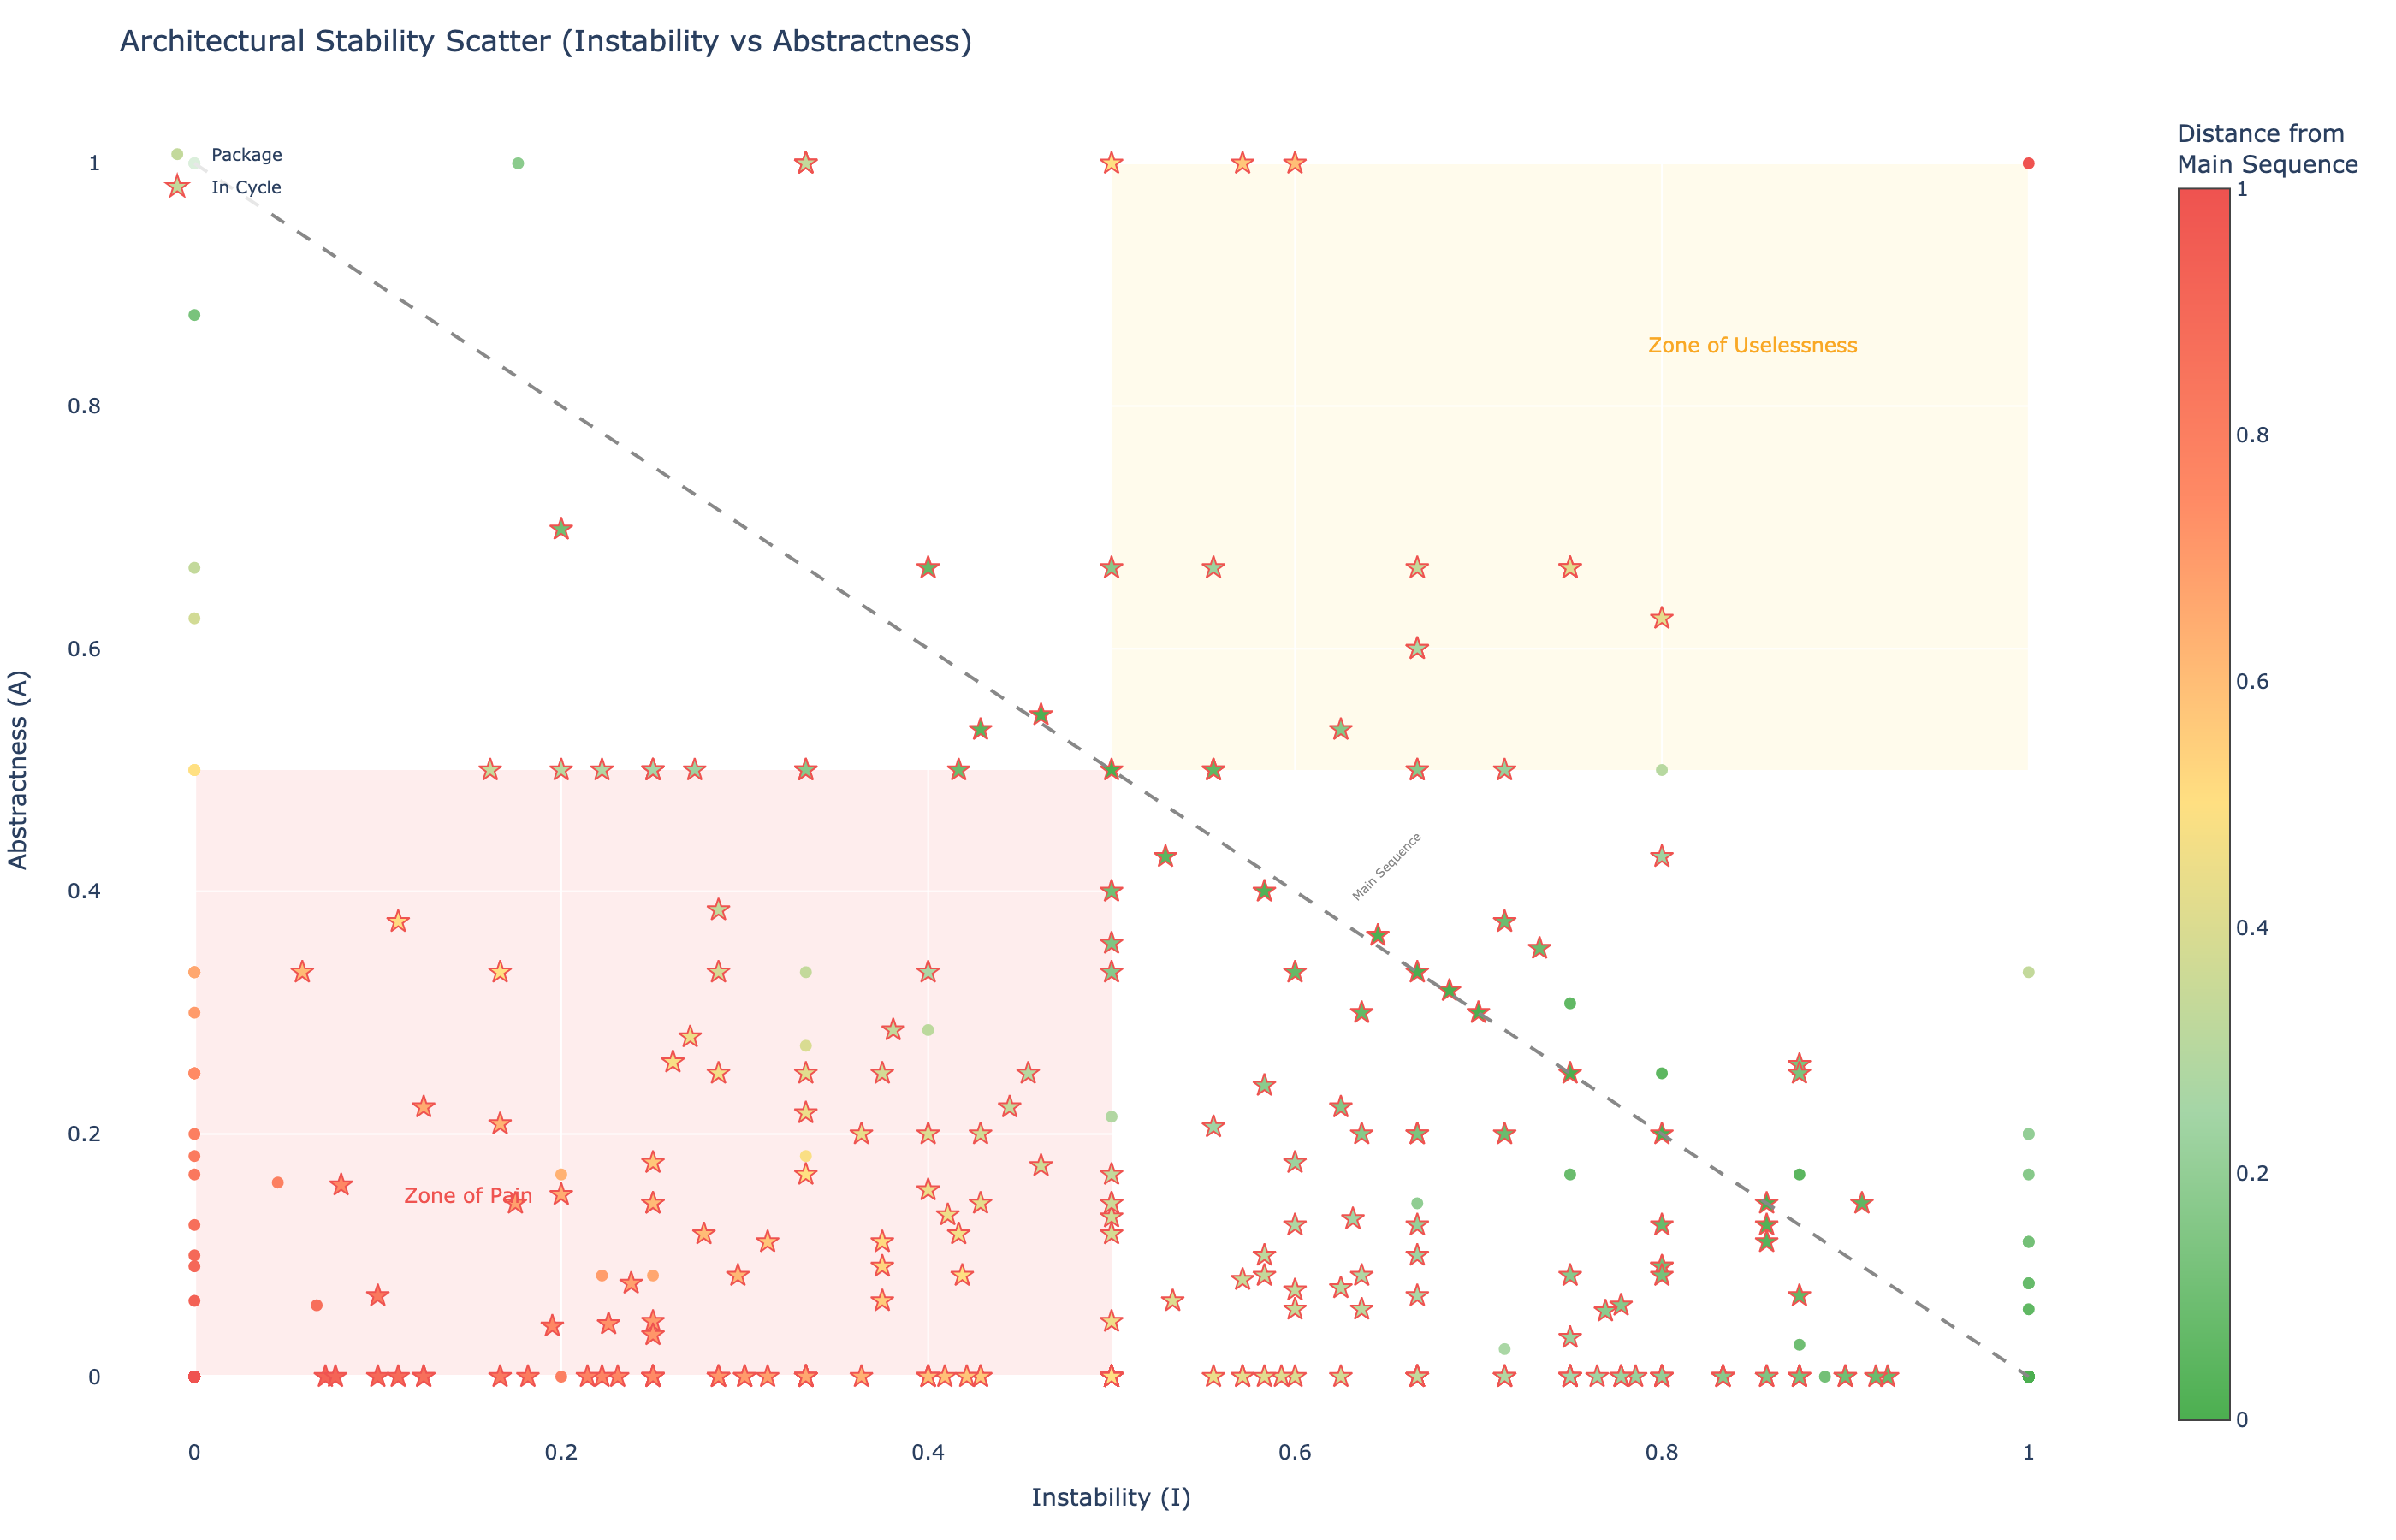
Robert Martin’s main sequence
The stability-abstractness diagram plots each package by instability (x-axis) and abstractness (y-axis, the ratio of abstract classes to total classes). The ideal line, called the main sequence, is A + I = 1.
Packages near (0, 0) are in the Zone of Pain: stable but fully concrete, hard to change because many things depend on them and there are no abstractions to extend. Packages near (1, 1) are in the Zone of Uselessness: abstract interfaces nobody implements.
Dependency cycle detection
The most important package-level signal is dependency cycles, circular dependencies that make independent deployment and testing impossible. Prethink uses Tarjan’s strongly connected components algorithm to find every cycle.
In a recent analysis of a large enterprise open source portfolio spanning over 100 repositories, nearly half of all packages were in dependency cycles. Most of those codebases had quality tooling in place. None of it was surfacing this information where agents could act on it.
Code smell detection: Composite thresholds
The metrics covered so far each describe a single dimension of quality. Code smell detection combines them into composite thresholds that identify specific design problems by name, with severity ratings and the metric evidence that explains why.
God Class
A God Class has accumulated too many responsibilities. Detection uses three metrics simultaneously: WMC >= 47, TCC < 0.33, and ATFD > 5 (accesses more than 5 foreign data attributes). Severity scales based on how far values exceed the thresholds. In our enterprise portfolio analysis, Prethink found 54 God Classes, with the worst-case class rating CRITICAL, handling hundreds of unrelated operations in a single class with WMC exceeding 300 and near-zero cohesion.
Feature Envy
A method exhibits Feature Envy when it uses more features of other classes than its own. Prethink flags it when foreign accesses >= 5 and foreign accesses exceed 2x own accesses. That’s the signal to the agent that this method is in the wrong class. The fix is usually a Move Method refactoring. In the same portfolio analysis, Prethink identified 5,745 Feature Envy instances, the most common smell by far, and the one most likely to indicate that an agent is about to add code in the wrong place.
Data Class
A Data Class contains only fields and accessors with no meaningful behavior: more than 2/3 of methods are getters/setters and behavioral WMC <= 3. Prethink found 109 Data Classes in the portfolio analysis. This often indicates an anemic domain model. The behavior that operates on a Data Class is usually sitting in another class exhibiting Feature Envy. An agent encountering both should consider bringing them together.
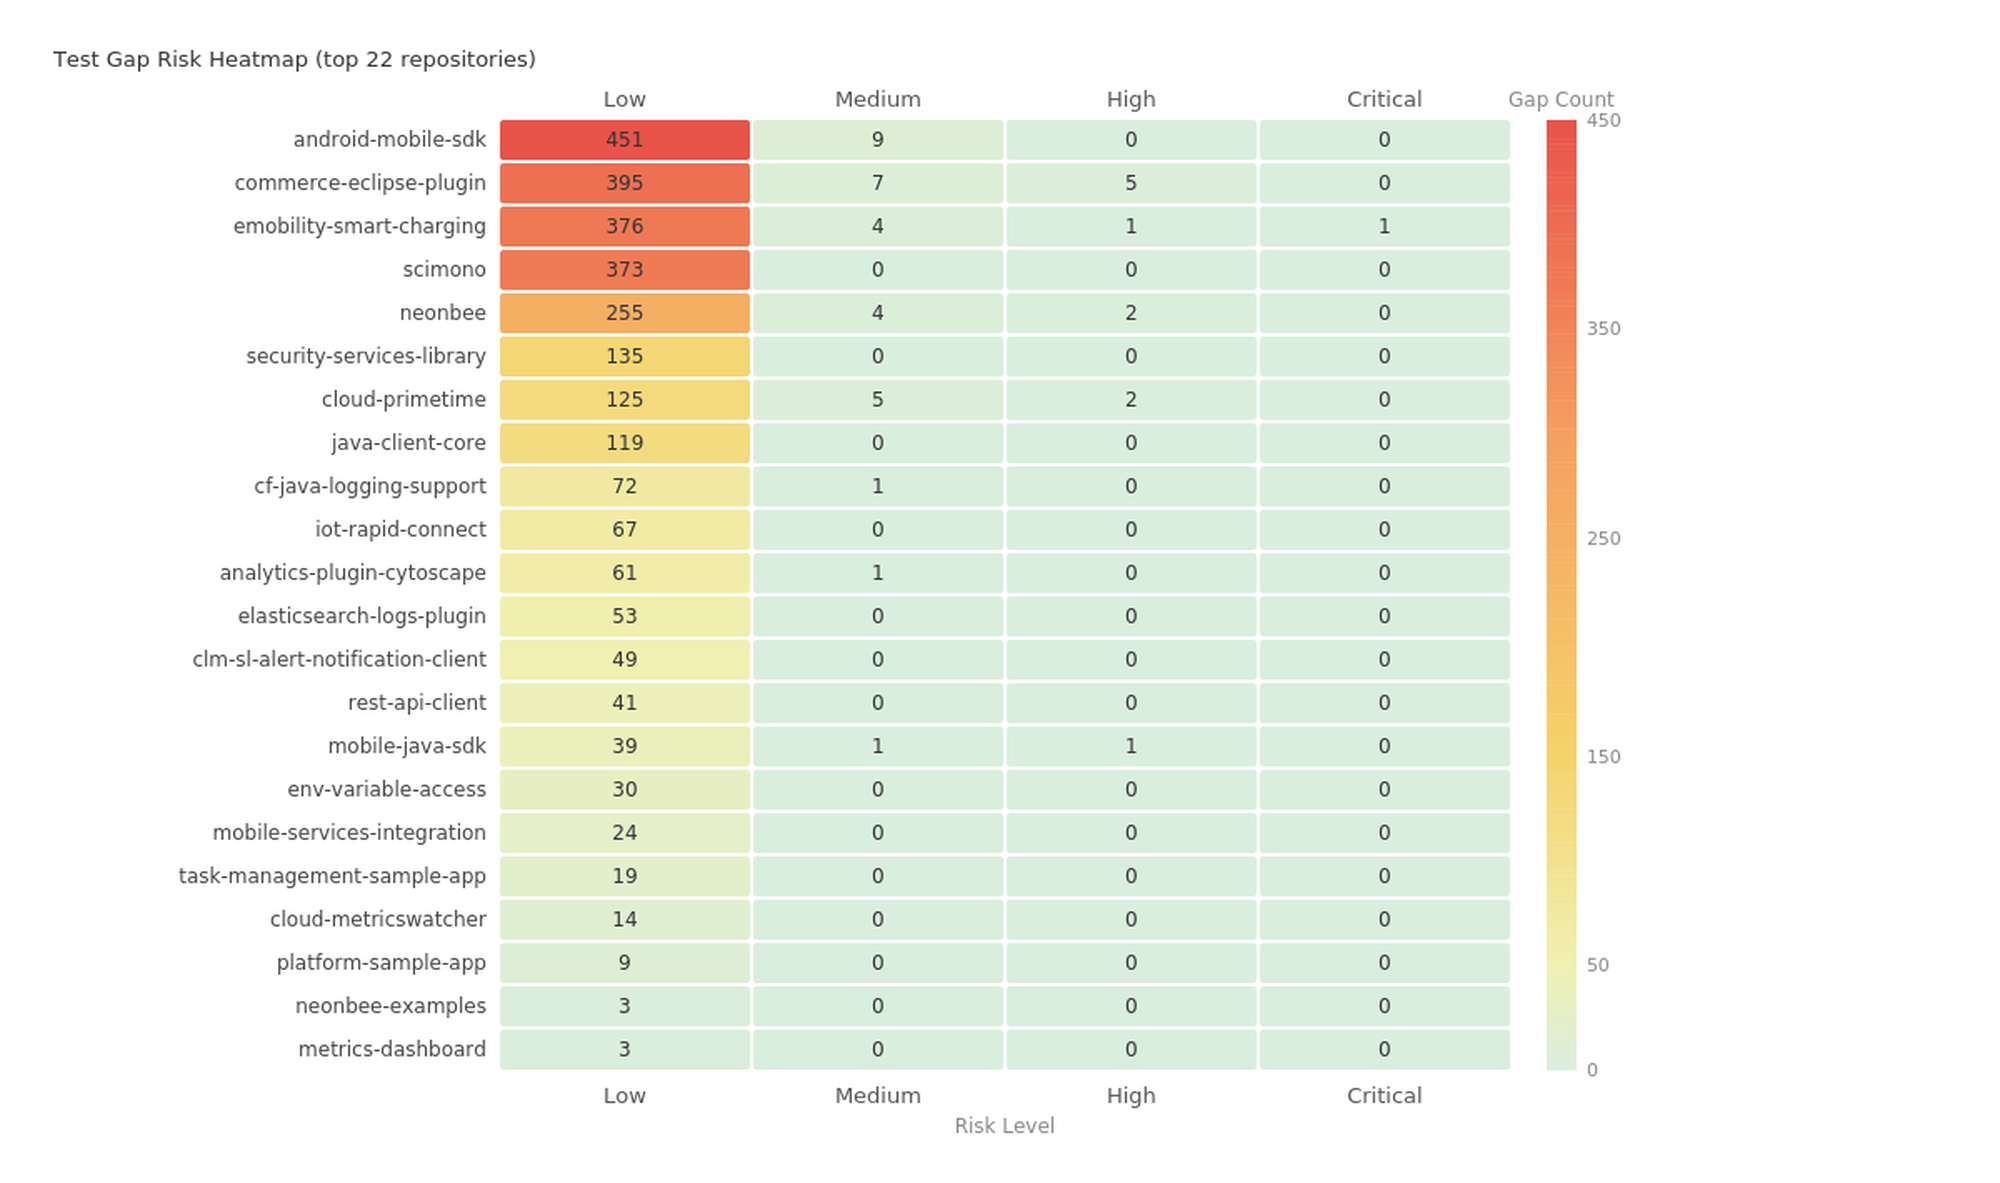
Test gaps: Where quality meets risk
Test gap analysis is the inverse of coverage mapping. Instead of showing what is tested, it shows what isn’t, ranked by how dangerous each gap is to leave untested.
Formula detail
A method with complexity 23 and 40 callers has a risk score of 943. A getter (complexity 1, any callers) has a risk score in the single digits. The agent knows the difference.
Prethink filters out trivial methods, getters, setters, toString, hashCode, equals, single-statement methods, so the gap list surfaces only the methods that actually warrant tests. In the 129-repository portfolio analysis, that filtering left 2,765 untested methods that genuinely warranted attention. Each entry includes a suggested test class, giving the agent a starting point rather than a blank page.
The combination matters because complexity and test coverage are independent signals. An untested getter with complexity 1 is not a meaningful gap. An untested method with complexity 23 called by dozens of other methods is the kind of gap that causes production incidents when an agent modifies it without context.
How agents consume this
Prethink materializes all of these metrics as files in the repository:
.moderne/context/
The CLAUDE.md or .cursorrules file references these context files. When an agent opens the repository it reads them automatically and knows which methods are complex, which classes should be split, which packages are in cycles, and where the highest-risk test gaps are.
The context is deterministic and versioned. The analysis runs once, in advance, and the results are authoritative. When Prethink runs again after a sprint, the agent gets updated quality intelligence without spending tokens rediscovering what already changed. Every session starts from a known-good state rather than rebuilding from scratch.
Quality measurement tells you where you are. Quality context tells your agents where to go.
Technical Reference
Ready to give your agents quality context?
The full technical brief goes deeper on every metric — with implementation details and real-world portfolio data.
Related posts